
Category: Matplotlib
-
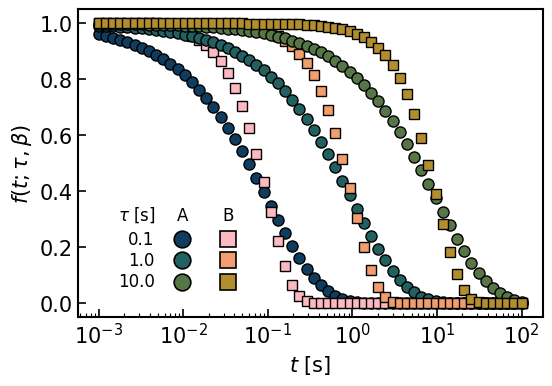
Matplotlib에서 table형식의 legend를 나타내기
최근 논문을 준비하면서 뭔가 여러조건에 대한 legend를 작성하면서 심심하다는 느낌을 많이 받았습니다. 다른 논문들을 보다보면 제법 예쁘게 legend를 표로 작성하여 삽입하곤 하는데, 그러한 부분들을 matplotlib내에서 자체적으로 해결하고자 ChatGPT 및 Copilot와 함께 작업했습니다. 생각해보면 AI의 발전 등을 통해서 원하는 바를 훨씬 손쉽게 작성할 수 있게 된 것 같습니다만, 그럼에도 불구하고 제법 이런저런 반복적으로 style을 정립하기까지 시간이…
-
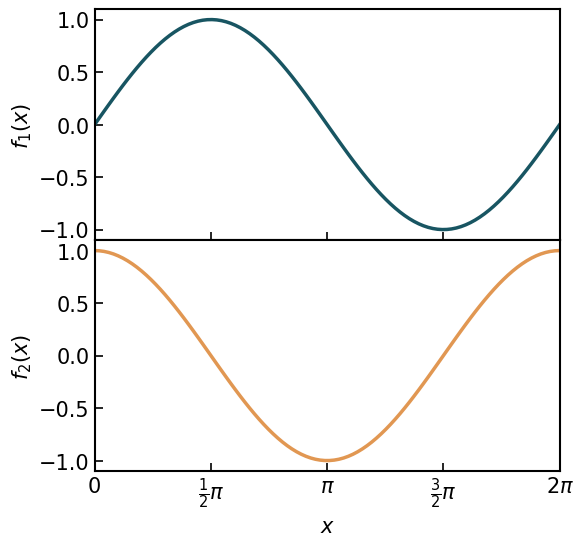
Matplotlib figure의 몇 가지 스타일 정의 + 위아래로 합쳐진 그래프 그리기
주로 사용하는 설정들 중, 특히 자주 사용하는 옵션들은 다음과 같이 정의해두고 있습니다. 예로들어 tick은 inward로 해야 한다거나, 외곽선의 두께는 일정수준이 되어야 한다거나 등의 부분입니다. 무엇보다도 다음과 같이 설정해두면, 한 Jupyter Notebook내에서 figure 설정이 동일하게 적용되므로 일관성있게 그래프를 보여 줄 수 있습니다. 그렇다면 해당 설정을 바탕으로, 위아래로 합친 그래프는 다음과 같이 구성할 수 있습니다. 여기서 Fabio…
-
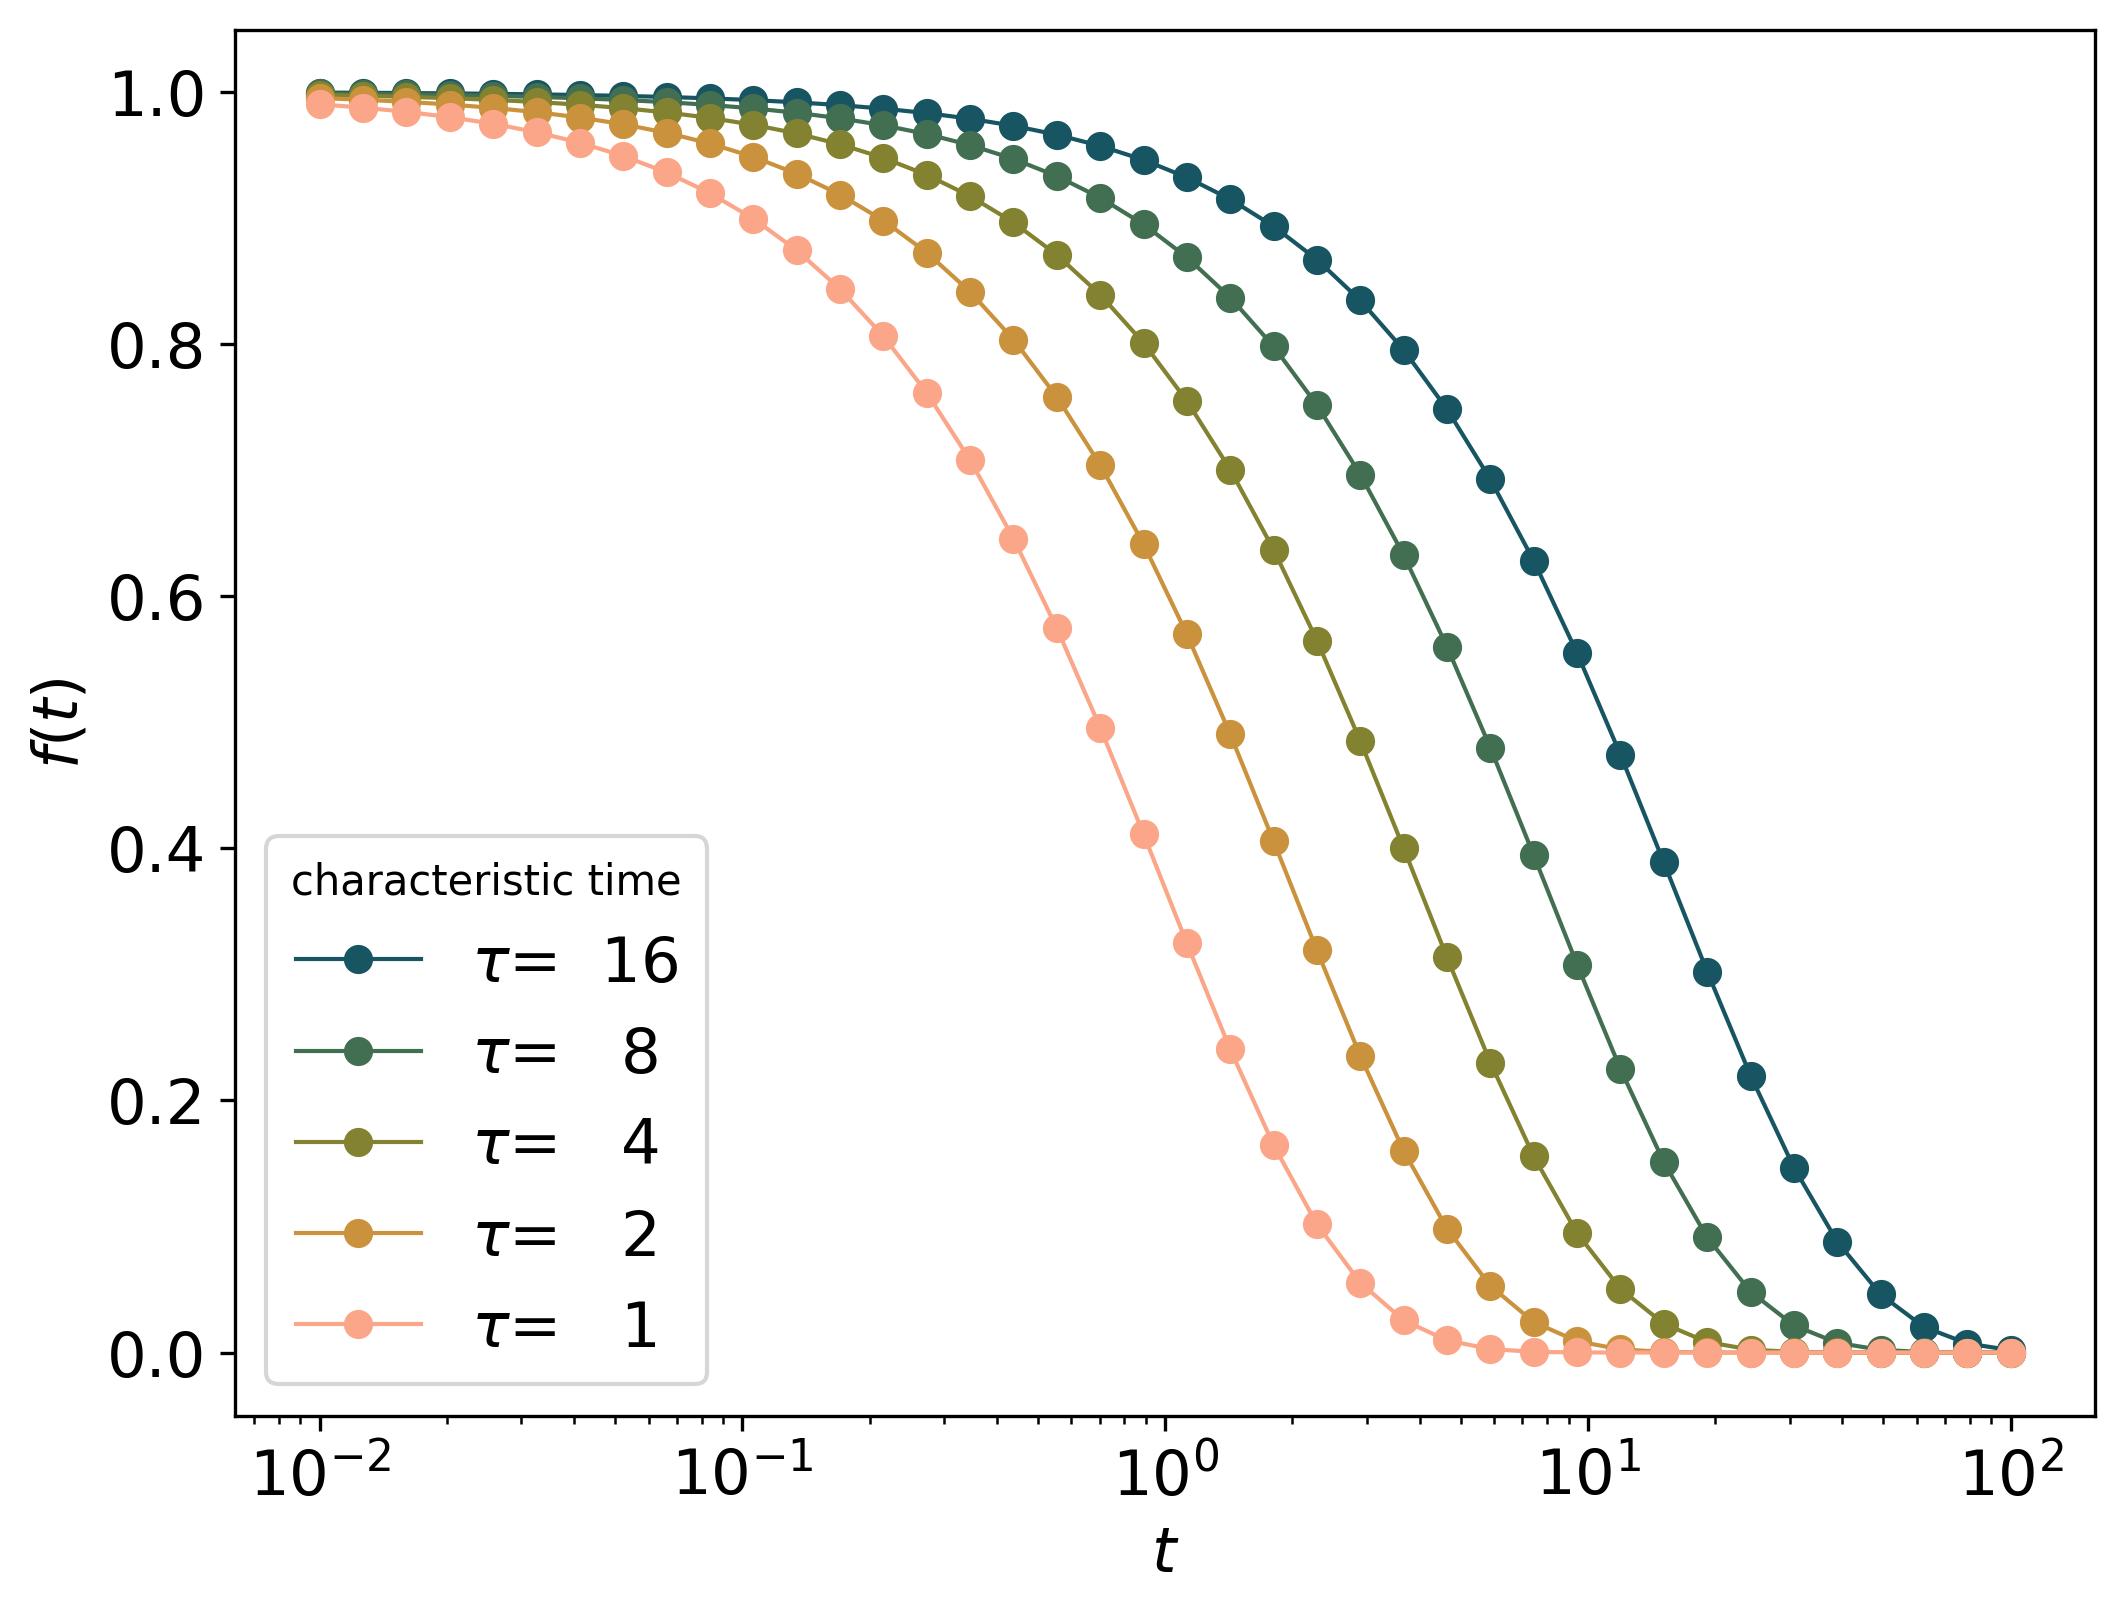
Matplotlib-Python에서 Fabio Crameri의 Scientific colour maps 사용하기
연구실의 동료가 소개해준 색상에 대한 선택인데, 몇 번 사용해보고는 의외로 그 품질이 마음에 들어서 여전히 사용하고 있습니다. 다음 공식 홈페이지 (https://www.fabiocrameri.ch/colourmaps/ )에 언급되어 있듯이 해당 색상 지도는 다음과 같은 두가지를 주안점으로 만들어졌습니다. 자세한 사항과, 각종 설명 및 시청각 자료는 저자의 사이트에서 참조할 수 있습니다. 여기에서는, 해당 색상지도를 Python환경에서 어떻게 사용할것인가에 주안점을 두고 있습니다. 저는 cmcrameri…
-
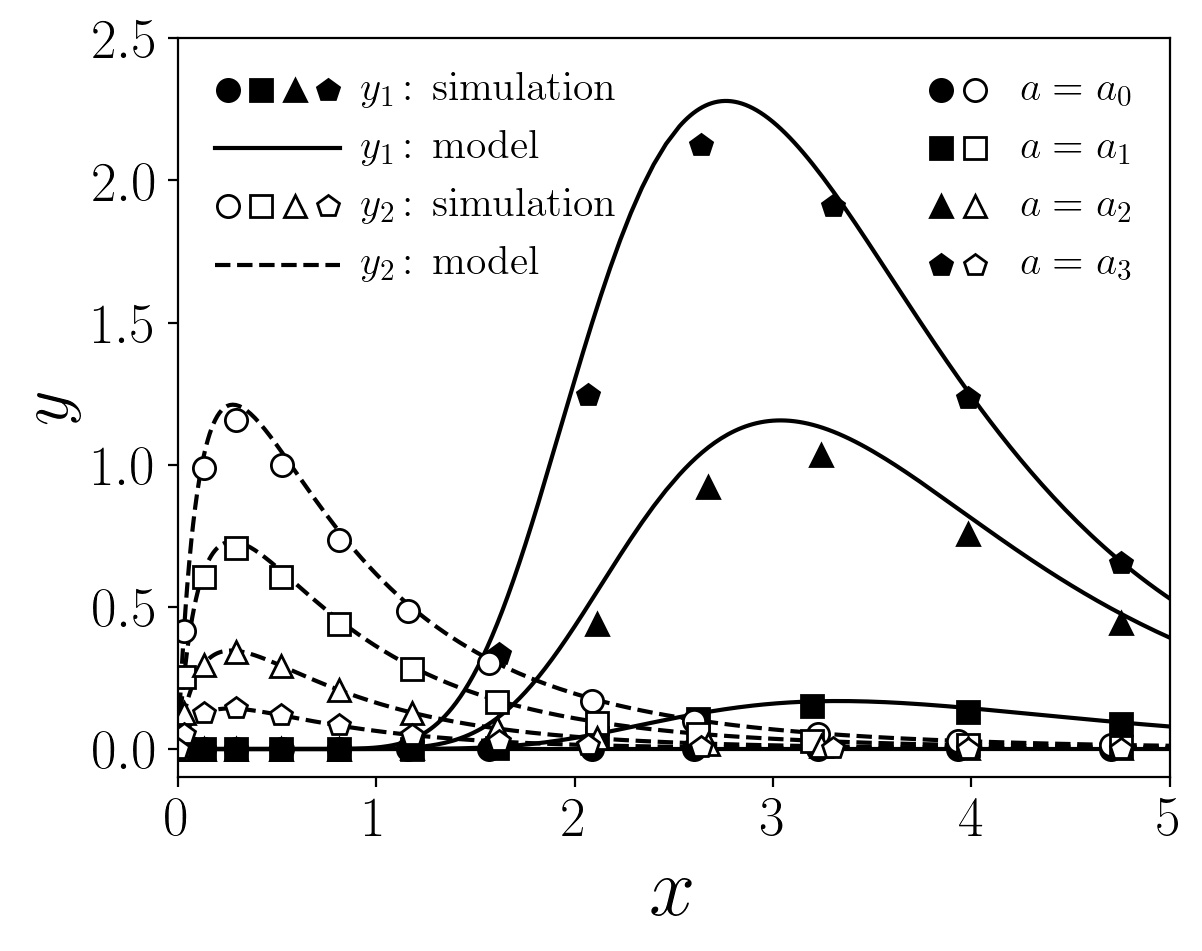
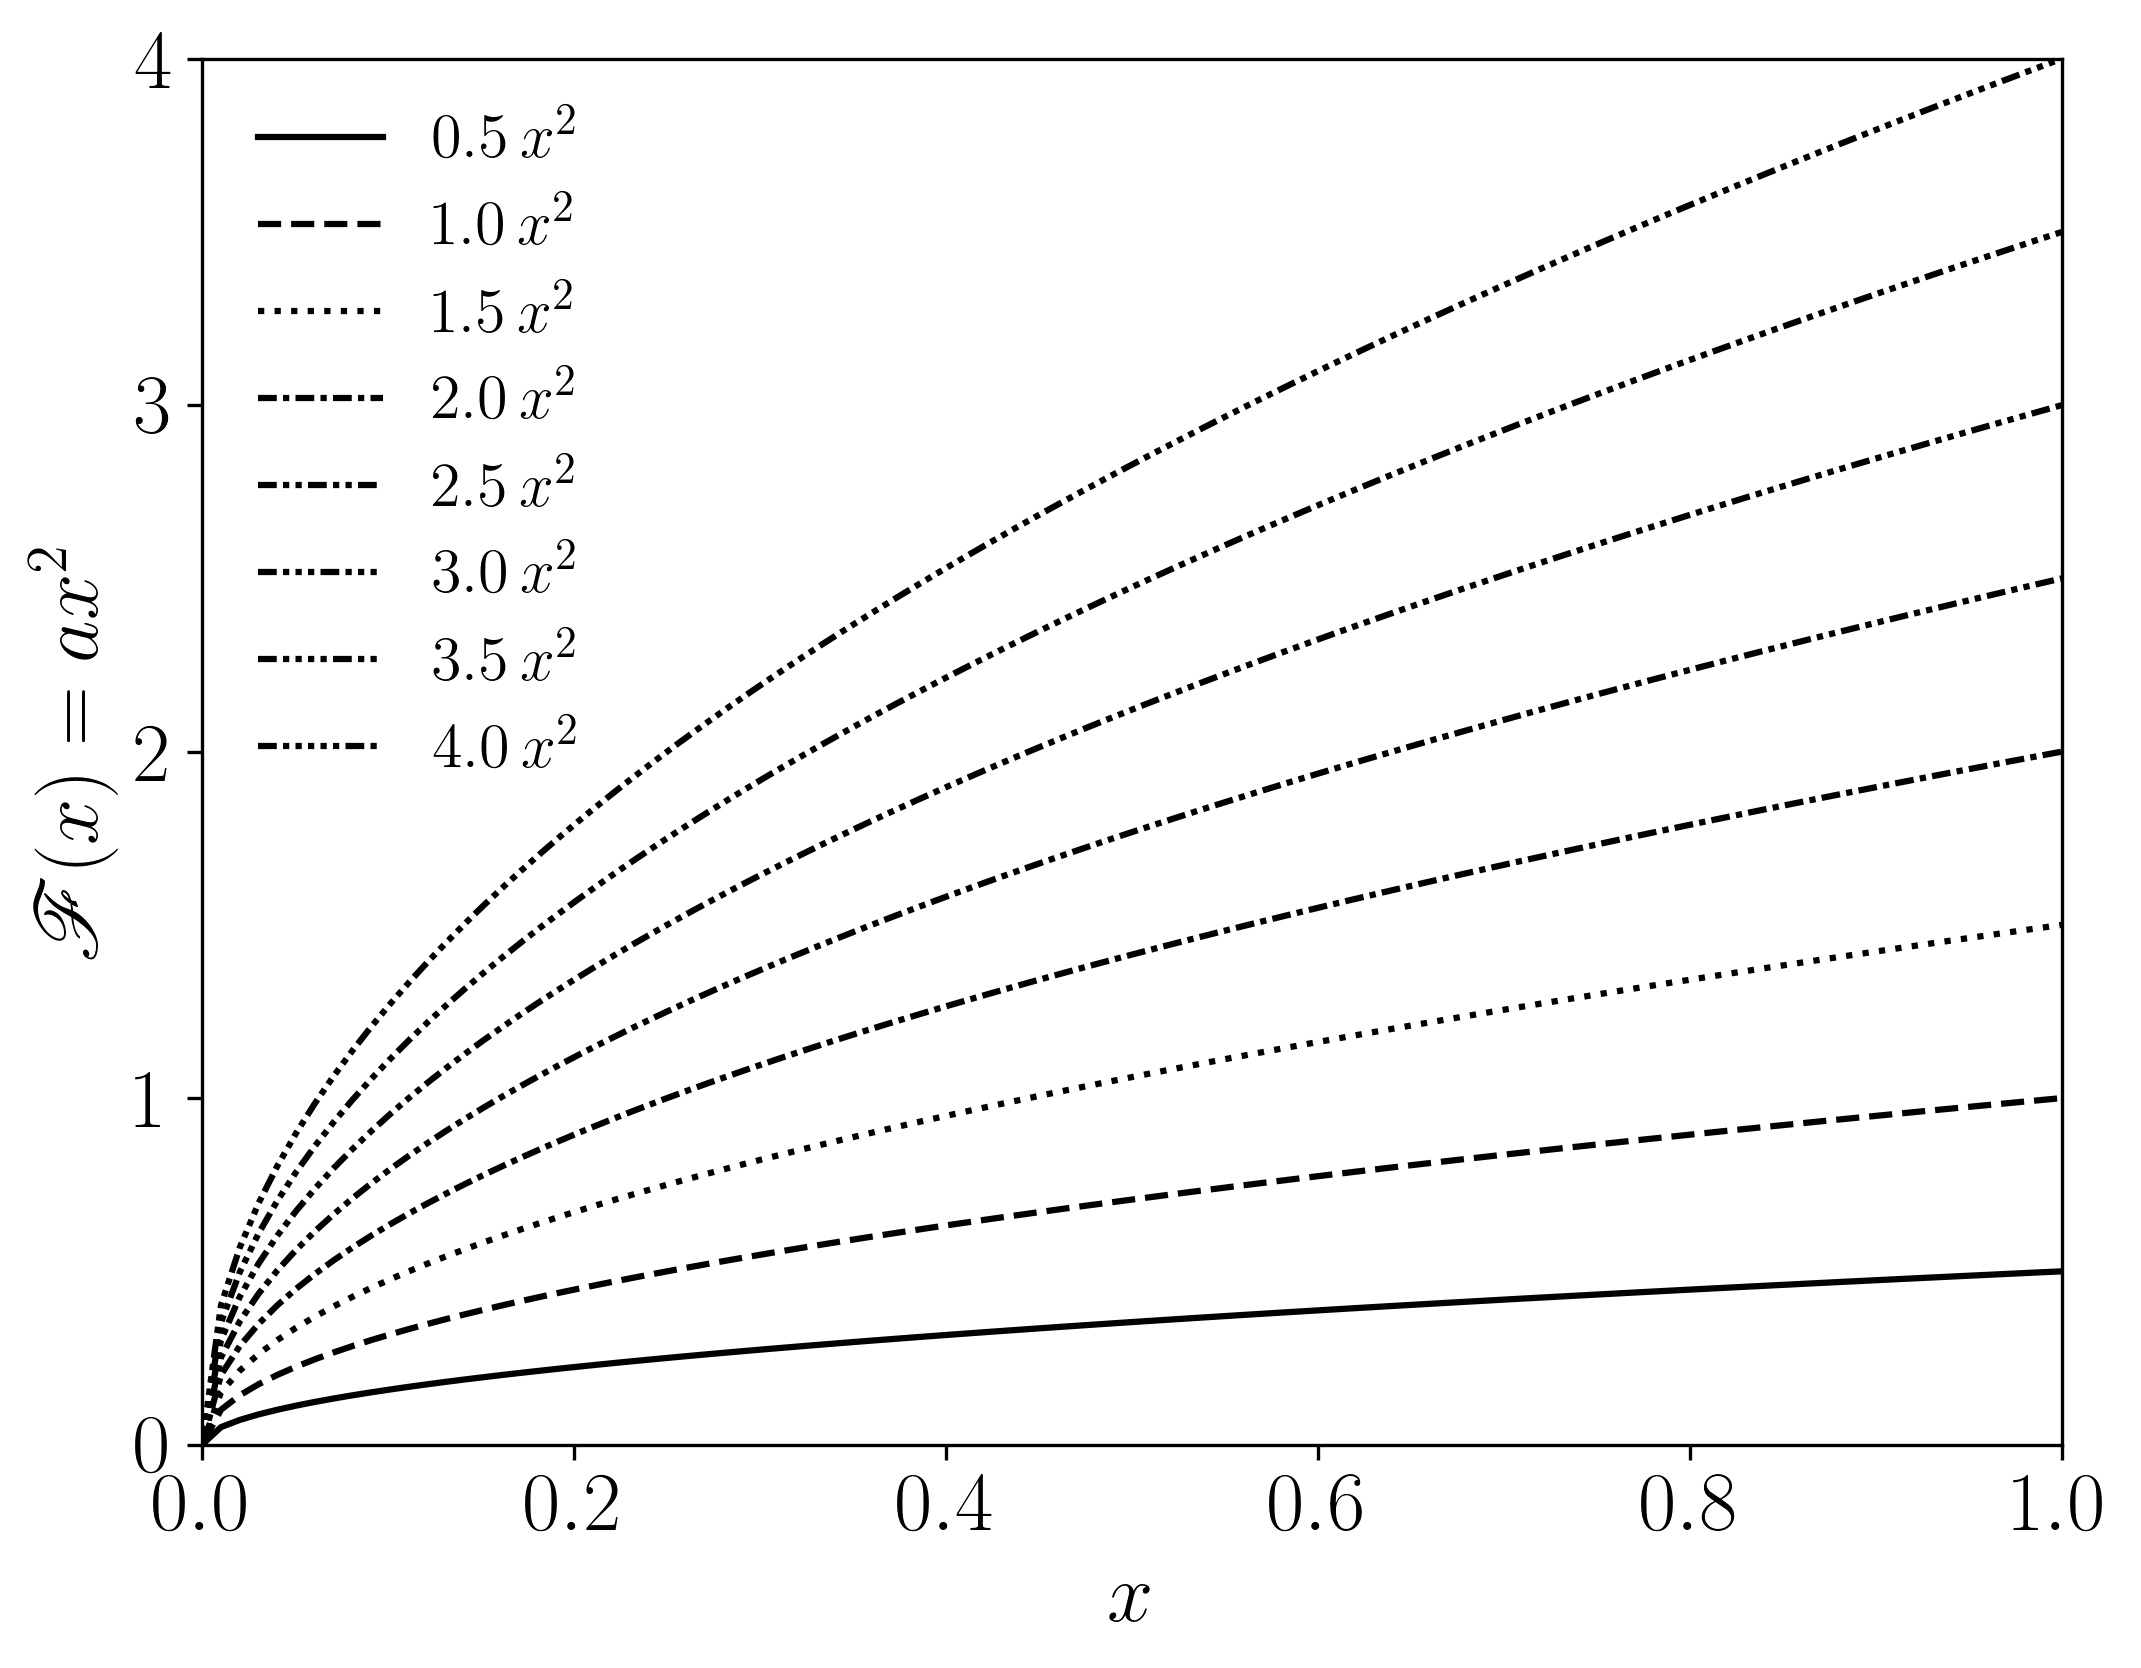
Multi-symbol legends in Matplotlib, Python (revised)
[update on 24 May 2025: I realized that some of my old blog posts have been broken due to formatting issues. Hence, I adopted it with the contemporary WordPress writing format in this section. ] Recently, I met a problem showing multi-dimensional information in a single black-and-white figure. This figure includes (i) simulation data and…
-
인텔맥 Big Sur에서 연구용 Python / Jupyter 환경설정 및 기본 활용 예시
먼저 굳이 인텔맥 Big Sur일 필요는 없다는 점을 밝혀둡니다. 다만, 저는 설정을 할 당시 그 시점의 환경을 기입해두곤 합니다. 이는 제가 모든 환경을 테스트 해 볼수도 없는 노릇이고, 그냥 쓰던 환경을 다시 쓸수있게 해놓고는 간단한 후기를 남기는 정도입니다. 최근 시스템 설정을 마치고 논문작업에 바쁜 나날을 보내다가 잠깐 여유를 부려 작성중입니다. 이는 지난 번 글(1, 2)에서…
-
Personal figure template using Matplotlib (Python)
I have been using Matplotlib for a long time to produce figures for scientific papers. As a person who is working on the theory and modeling, generating figures using a scripting language minimizes the effort to spend on analysis and produces results. The great flexibility of using a scripting language is a major benefit, regardless…